
We’ve probably all seen the spectacle of a pre-fight weigh-in on TV. Boxers strut and trash-talk each other, while sometimes the theatrics turn into a brawl with trainers and supporters also getting into the action.
Notwithstanding the histrionics, there is also serious side to the weigh-in. Fighters will often ‘cut weight’ coming into a weigh-in, involving rapid weight loss prior to competition. Boxers dehydrate themselves in order to compete within a specific weight class. Individuals can lose up to 15 kilograms within a 48-hour period.
In a professional bout, after weigh-ins, fighters are given 24 hours to rehydrate before the competition. This means that a fighter weighing in at 75kg on Friday could show up to the Saturday fight weighing 85 or 90kg.
These tactics can give a fighter a huge advantage on fight night. When fighters cut weight, they do so in order to gain a size advantage over their opponent. In the realm of professional fighting, size does matter. The bigger you are, the harder you hit, the harder you are to hit, and the more your attacks exhaust your opponent. The fighter who masters how to effectively cut weight will always have the upper hand.
Benchmarks and Incentives for Superannuation Funds
The weight class system creates an incentive for boxers to engage in gamesmanship such as cutting weight. In a similar way, might a focus on peer relative returns incentivise a superannuation fund to engage in a form of weight cutting tactics? If so, how might they do it?
Before we answer these questions it’s worth thinking about incentives. Here’s what we know:
- Historically, growth assets such as shares out-perform defensive assets such as bonds around 60-80 per cent of the time.
- Competition is intensifying as the government and the regulator are keen to promote consolidation of the superannuation industry.
Like a boxer trying to make weight, super funds could be incentivised to run portfolios that pack as much punch as possible (i.e. highest weighting to growth assets) while still making the ‘Balanced’ weight division.
The pressure to ‘make weight’ would intensify as more and more funds adopt such tactics. Nobody wants to be slugging it out against a competitor that’s running a growth assets exposure that’s 10-20 per cent higher!
The result could be funds running riskier and riskier portfolios in an effort to ‘punch above their weight’. The incentives to do this would be even stronger if the variable compensation of super fund management depended on beating a peer benchmark.
What do Growth, Defensive, Income or Capital Appreciation mean?
Most multi-asset performance surveys group funds together based on their allocations to growth (capital appreciation) or defensive (income) assets. But what do these labels mean? Truth is, they mean different things to different funds.
In fact, they can mean pretty much whatever a fund wants them to mean. Most industry performance surveys don’t define what is growth and what’s defensive. Asset allocation data is self-reported by super funds, so it’s up to each fund to define what’s growth and what’s defensive. As you can probably imagine, self-reporting leads to considerable variation between funds.
Unlike a title-fight, there’s nobody policing the weigh-in for super funds. Ratings agencies don’t check how a fund determines its growth/defensive split. The result is that funds taking ‘middle-weight’ investment risks are competing with funds taking ‘heavy-weight’ investment risks.
Many assets exist in a grey area. Take property as an example. Some funds will argue that property is a growth asset while others will argue that it’s defensive. Some funds will seek to categorise their property investments based on their economic exposures. Investments focused on earning income from rent are classified as defensive, while investments focusing on construction and development are classified as growth. Other funds might split property by the type of investment vehicle used. Unlisted investments being categorised as defensive while REITs are classified as growth.
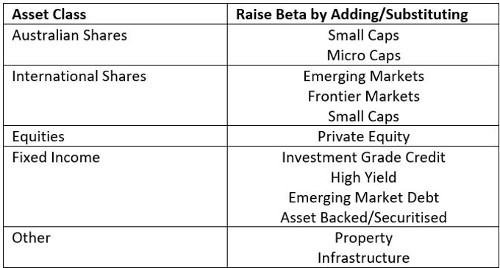
There’s also a subtler way to make weight. It’s by using asset classes and sub asset classes that have high equity betas. In other words, it’s possible to increase the beta of a fund while still reporting a ‘balanced’ growth/defensive split.
Here’s how it could be done. Swap the asset class on the left with one or more of the asset classes on the right.
We can illustrate how this works with a few examples. Firstly, we need to create a ‘superannuation fund equity beta (SFEB)’ which I’ve done using the following mix, rebalanced monthly:
- 50 per cent ASX 300 Accumulation
- 25 per cent MSCI World ex Australia Net Total Return (hedged)
- 25 per cent MSCI World ex Australia Net Total Return (unhedged).
Secondly, we can compare the performance of the sub asset classes listed on the right to the performance of our SFEB to see the beta of each asset class. For the sake of brevity, we’ll consider only three examples, Australian small cap shares, emerging market shares and unlisted infrastructure.
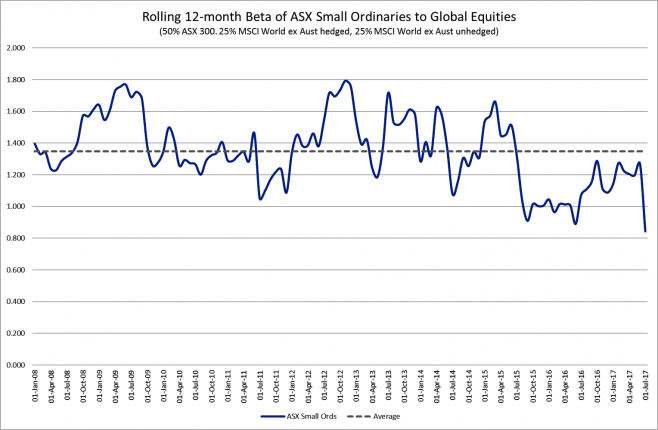
The chart above shows the SFEB of Australian small cap shares. The rolling 12-month beta has averaged 1.35x over the last 9 years. Substituting Australian small cap shares for large caps has the equivalent effect of gearing the equity allocation by 1.35 times the amount allocated.
Australian small caps and large caps are both generally considered to be growth assets. So, the growth/defensive split remains unchanged. Meanwhile the equity beta of the overall balanced fund increases.
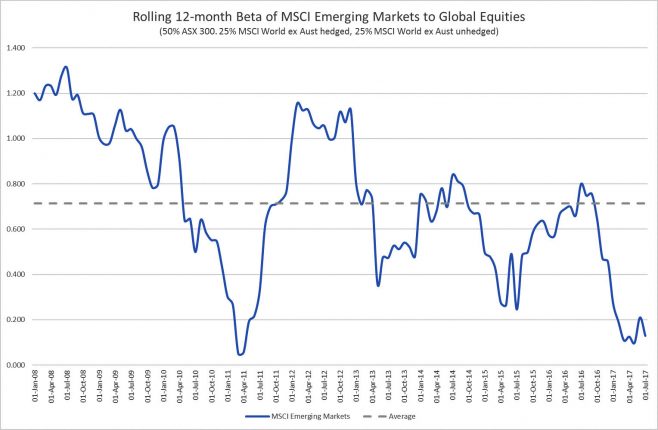
It’s a bit more difficult to determine the SFEB of emerging market equities due to the diversifying effects of currency. Still as the chart below shows, it’s probably safer to assume that the beta is likely to be higher than 1 during periods of market stress.
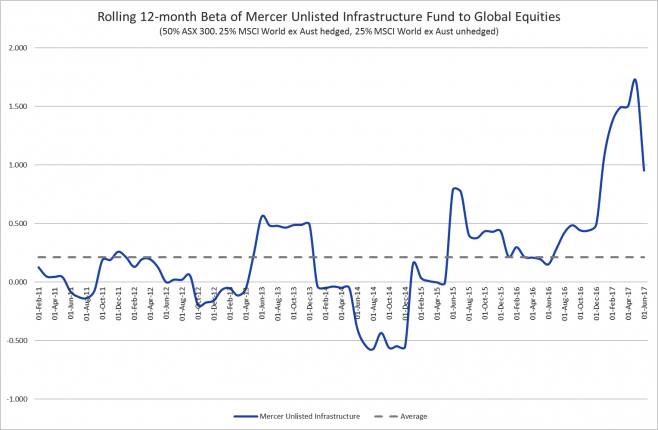
What about unlisted assets? Superannuation funds might be tempted to replace low-yielding bonds with assets such as infrastructure. They may reason that, as long-term investors with positive cash flows, they can tolerate the reduction in liquidity. They may also conclude that the CPI-linked income paid by many infrastructure assets might help to insulate a balanced portfolio against higher interest rates.
All of which might be true, but unlisted infrastructure also comes with additional equity beta that’s not present in high-grade sovereign government bonds. The chart below shows that the SFEB of the Mercer Unlisted Infrastructure Fund has averaged 0.2. But notice the spike in rolling 12-month beta to 1.7x during the period of rising interest rates at the end of 2016/beginning of 2017.
Compare the Pair
Let’s investigate how the asset classes considered above can be combined to create balanced funds that make weight and pack a punch. To do this we’ll compare two funds.
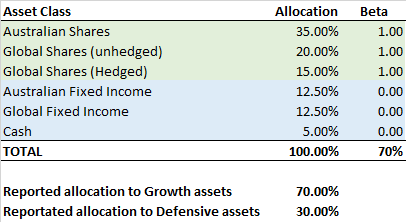
The first fund is a simple 70:30 fund. Growth assets are shown in green and defensive assets are shown in blue. For the sake of simplicity, I’ve assumed that the bonds in this portfolio are government bonds with a SFEB of zero (it’s probably slightly negative).
The second balanced fund has a more complicated strategic asset allocation (SAA) using additional asset classes and sub-asset classes. Assets that could be considered part growth/part defensive and open to self-reporting interpretation by the fund are shown in orange.
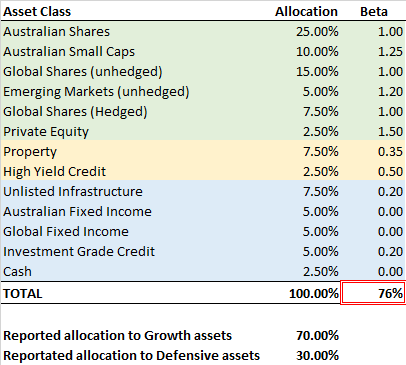
The betas used in the second portfolio are my assumptions. They are consistent with the betas observed over the last few years.
Both portfolios have a 70:30 growth defensive split, but the second portfolio has an effective equity beta of 76 per cent. In other words, it’s really a 76:24 fund.
Remember, growth assets usually out-perform defensive assets between 60-80 per cent of the time. The second portfolio has ‘made weight’ and is punching a lot harder.
70:30 or 90:10?
One of the main performance surveys used by superannuation funds is the Super Ratings SR50 Balanced Index (SR 50). To qualify for inclusion, a super fund must have between 60-76 per cent invested in self-reported growth assets.
As the two funds above show, the equity beta of a balanced fund can be much higher than the reported growth/defensive split would suggest.
In fact, it’s possible for a balanced fund to have an effective growth/defensive ratio of close to 90:10 (as measured by equity beta) while still reporting a growth/defensive ratio that qualifies for inclusion in the SR 50.
Don’t believe me? Consider the following. Vanguard offers a series of multi-asset funds consisting entirely of index investments in listed asset classes. It’s Growth option has a 70:30 growth/defensive split and its High Growth option has a 90:10 growth defensive split.
I took the gross returns from the Vanguard website and made two adjustments:
- Subtracted an effective tax rate of 10 per cent. This is approximately the effective tax rate of most superannuation funds (-15 per cent tax plus franking credits on Australian shares).
- Subtracted investment costs of 0.75 per cent. This is much higher than the 0.29 per cent fee that Vanguard charges wholesale clients to invest. It’s also a very conservative estimate of the full look-through cost of a superannuation fund which is somewhere between 0.75 – 1.25 per cent depending on the fund.
What would have happened if we invest $50,000 in three superannuation funds 10 years ago: Vanguard 70:30 (dashed line), Vanguard 90:10 (dotted line) and the SR 50 (orange line)?
The chart below shows that the cumulative performance of the SR 50 is very similar to the performance of the Vanguard 90:10 fund (adjusted for tax and fees).
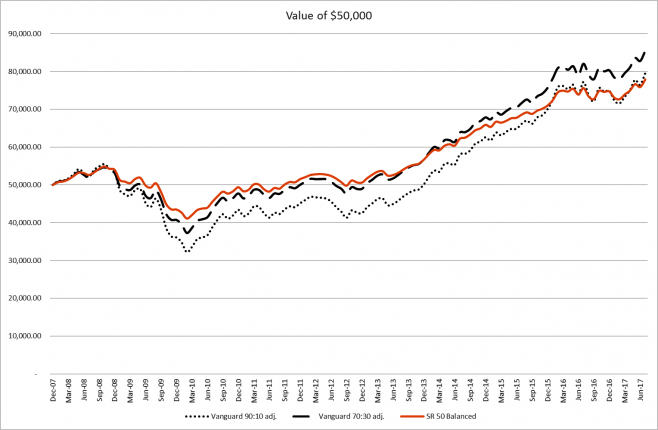
Surprisingly, the Vanguard 70:30 has out-performed the 90:10 over the last 10 years. Its higher allocation to bonds helped during the global financial crisis. The fall in interest rates since the crisis has meant that the returns from bonds have kept pace with equities since the crisis.
The strong performance of stocks and bonds over the last 10 years also makes it tough to differentiate whether or not the equity beta of the SR 50 is similar to the Vanguard 70:30 or the 90:10.
How does the performance of the three funds compare on a rolling 12-month basis? The SR 50 experienced lower lows during the global financial crisis and lower highs following the crisis. This is what we’d expect as the SR50 is more diversified.
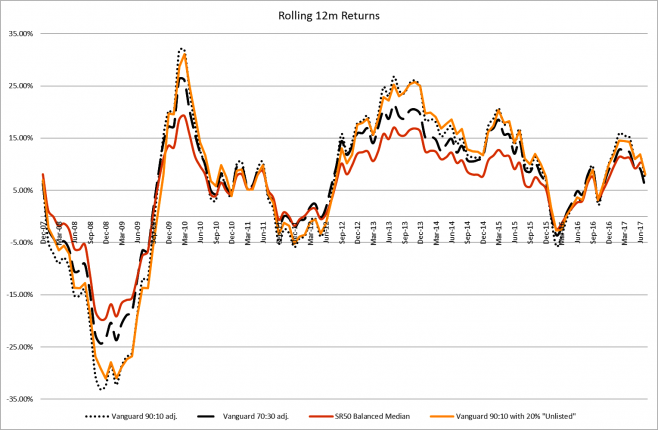
All in all, the three funds move broadly in-line with each other. Remember, this is the median super fund. Running this same analysis for top-performing funds would show higher rolling returns; returns that are more consistent with a 90:10 rather than a 70:30 fund.
You’ll notice a fourth line added to the chart above: Vanguard 90:10 with 20 per cent invested in unlisted assets (yellow line). In truth, there are no unlisted assets in this portfolio. Instead, I took the Vanguard 90:10 monthly returns and staggered them to create 3-month, 6-month, 9-month and 12-month returns. I did this to mimic the periodic valuations of unlisted assets. I allocated 20 per cent of the fund to an equally-weighted mix of these staggered returns.
As you can see in the chart above, this made almost no difference to returns. The returns of the Vanguard 90:10 with and without ‘unlisted’ assets were very similar. But it made a HUGE difference to risk as you’ll see in the chart below.
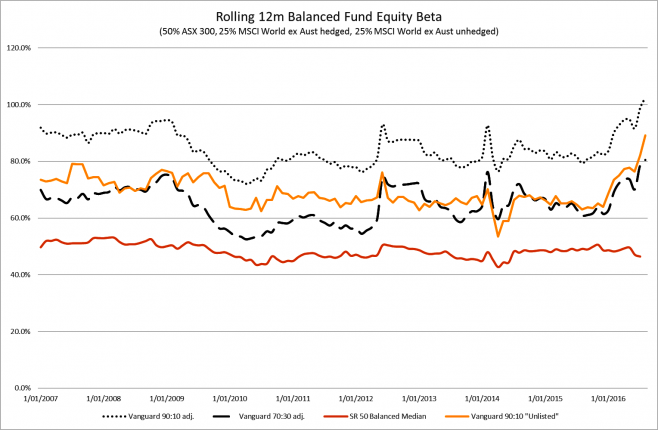
The rolling 12-month SFEB beta magically drops from around 0.90 (which is consistent with a 90:10 allocation) to around 0.70 (consistent with a 70:30 fund). The assets are identical and the rolling 12-month returns are identical. The only difference between the two funds is that in one fund 20 per cent of the assets are not market-to-market.
What’s the point of this exercise? To illustrate how investing in unlisted assets can theoretically help a superannuation fund ‘make weight’. The volatility smoothing that comes from less-frequent valuation makes the same portfolio of assets appear less risky. This allows a fund invest a greater amount in growth assets while not appearing anymore risky.
Notice that the equity beta of the SR 50 is even lower still. It’s around 0.5, which is what you’d expect of a 50:50 fund. What’s happening? My guess is that the additional risk reduction comes from two sources:
- The inclusion of additional asset classes that are not perfectly correlated with stocks and bonds
- A higher level of foreign currency exposure
Making Weight – A Checklist for Superannuation Funds
In summary, it’s possible to make a 90:10 portfolio appear as risky as a 70:30 portfolio (or even a 50:50) through a combination of:
- Self-reporting
- Substituting higher equity beta assets
- Smoothing volatility by investing in unlisted assets
- Increased diversification (adding more asset classes that aren’t perfectly correlated, except in a crisis)
- Relying heavily on foreign exchange exposure to reduce risk
A lot of time and money to get similar returns to an index 70:30 or 90:10 portfolio, albeit with less volatility. But is it really less volatile? Or has the strong recent performance of most asset classes hidden the true level of risk? And will the typical Balanced superannuation fund act like a 90:10 fund during stressed market conditions? Only time will tell.
Why aren’t the performance ratings services looking at this more closely? Why are they potentially allowing their surveys and ratings to be gamed by the funds that they’re ostensibly monitoring?
This analysis also allows us to figure out roughly the cost of reducing volatility across the entire superannuation industry. Remember, the returns of the two Vanguard funds were penalised with a 0.75 per cent fee instead of the 0.29 per cent charged by Vanguard. And the typical full-look through fee for a superannuation fund is around 1 per cent.
So, the imputed cost of volatility reduction is 1 per cent – 0.29 per cent = 0.71 per cent per year. On $2.5 trillion that’s roughly $17.75 billion dollars every year!
Instead of paying high fees to reduce volatility by holding a variety of asset classes, the fees saved by using index funds would allow funds to reduce their allocation to growth assets by 5-10 per cent and still earn similar returns. In other words, funds could take less risk on behalf of their members without them being any worse off.
Or funds could maintain their allocations as they are and earn a higher return, accompanied with higher volatility. This shouldn’t be a problem for members in the accumulation phase with a long investment horizon.
But funds are unlikely to do this if the incentives remain to engage in gamesmanship at the weigh-in by creating higher risk portfolios that look like balanced portfolios.
__________
[i3] Insights is the official educational bulletin of the Investment Innovation Institute [i3]. It covers major trends and innovations in institutional investing, providing independent and thought-provoking content about pension funds, insurance companies and sovereign wealth funds across the globe.