
Venture capital might look like a sure way of boosting a fund’s performance in the YFYS test, but recent cracks in the asset class’ return profile shows the pendulum swings both ways, Daniel Grioli writes.
I’m writing this column on Tuesday 14th of June. The S&P 500 has just experienced a savage -3.88 per cent selloff, taking the index to new lows. Fast growing, innovative and newly-listed stocks fared far worse.
- ARKK Innovation ETF (ARKK) -8.80%
- Invesco NASDAQ Next Gen 100 ETF (QQQJ) -5.60%
- iShares Russell 2000 Growth ETF (IWO) -5.03%
- Defiance Next Gen SPAC Derived ETF (SPAK) -5.16%
- First Trust US IPO Index ETF (FPX) -5.59%
Thankfully, venture capital was unaffected by the selloff.
That last sentence should have jarred you because it makes no sense.
How can venture capital remain unscathed when ETFs investing in the same high growth industries (ARKK, QQQJ and IWO) are getting pummeled? Surely the performance of newly listed stocks (proxied by ETFs such as SPAK and FPX) means the prospects for venture capital have darkened? After all, the end goal of most venture capital investments is to list on the stock exchange.
And yet, many institutional investors and even regulators treat venture capital investments as if they are immune to market gyrations.
Venture capital investments are not marked-to-market. Instead, they are valued if there is a corporate event (e.g., a new funding round), periodically (e.g., annually) or at the discretion of the investor (e.g. impairment). This makes them appear to be less volatile than they really are.
Please see my earlier column How Superannuation Funds Can Play the Rating Game for a full discussion of the effects of infrequent valuation on perceived volatility and risk.
Investors have arguably been able to “get away” with infrequent valuations thanks to decades of low inflation and falling interest rates. Benign economic conditions have given central banks the flexibility to intervene and support economic growth. They had room to cut interest rates and create liquidity.
The effect of this has been to make recessions both less frequent and less severe. When a recession has occurred, central banks have thrown unprecedented levels of monetary stimulus at it.
Financial markets recovered quickly, often in less time than it took for venture capital valuations to reflect any change. V-shaped bottoms in the stock market became the rule rather than the exception.
For example, here is how long it took the Dow Jones Industrial Index (DJIA) to recover in each of the bear markets since the Global Financial Crisis:
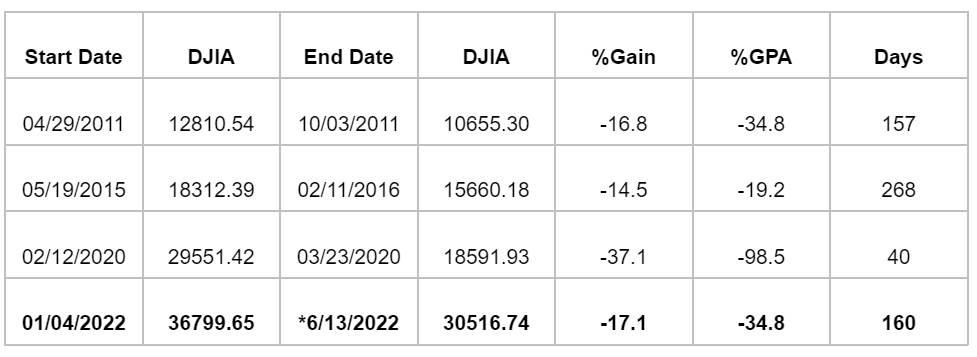
The median for all bear markets (n=37) is a 26.9 per cent decline over 353 days. Recent bear markets have, with the exception of 2020, been less severe. Recovery has been much faster too.
What happens to bear markets during periods of high inflation and rising interest rates? Unsurprisingly, bear markets are more severe. They also last longer.
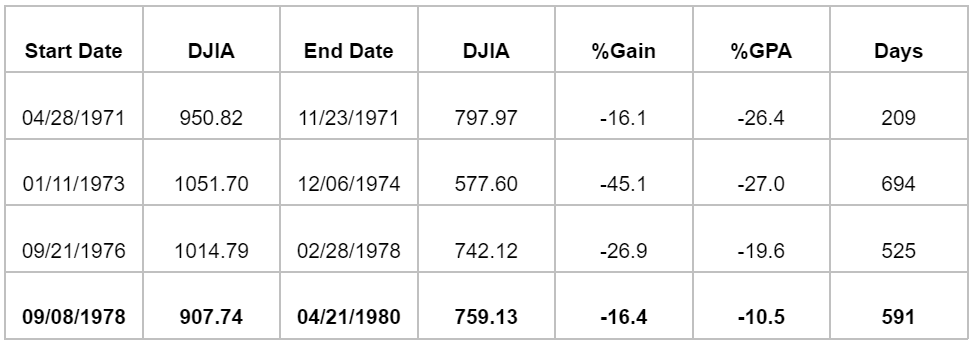
Data is courtesy of Ned Davis Research.
Short and shallow bear markets allow venture capital investors to ride out volatility. This may not be possible in a deep and protracted bear market. At some point, investors will have to mark-to-market, and it is more likely that they will need to recognise losses when they do.
Defying CAPM
The Capital Asset Pricing Model (CAPM) describes the relationship between systematic risk and expected return. All other things being equal, the higher the level of risk, the higher the expected return. The model has its problems, but most investors agree that higher return and higher risk usually go together.
An investment offering an expected return that is 20 to 50 per cent higher than listed equity should be riskier. Otherwise, the logical intuition underlying CAPM is rubbish. Either venture capital HAS to have a lower return or it HAS to be riskier.
A low return wouldn’t prompt investors to allocate to venture capital as part of their growth asset allocation. And they certainly wouldn’t pay high fees, including performance fees, on a low-returning asset.
Logically, venture capital is risker than listed equity. We can get a sense of how much riskier by examining the Refinitiv Venture Capital Index. The index uses listed equities in industry sectors that are popular within venture capital to proxy venture capital returns.
Over the last five years to April 2022, the index has returned 21.12 per cent per year, versus 16.40 per cent for the NASDAQ Composite Index (all figures in USD). The Refinitiv Venture Capital Index has outperformed by +4.72 per cent per year, meaning that its return was 28.7 per cent higher than the return on listed equities. These figures are consistent with most investors’ excess return expectations for venture capital (versus listed equities).
What is even more impressive is that these five-year numbers include a horrendous year-to-date return of -45.77 per cent:
- January -20.25%
- February -13.58%
- March 3.83%
- April -24.22%
This is the first decline of this magnitude since the index began in Oct 2012. Index returns have been positive every year from 2013 to 2021.
Not even the artificially dampened volatility created by infrequent valuation will be able to hide this sort of damage if it continues for much longer.
Venture Capital and Your Future Your Super
The APRA MySuper Heatmap Methodology White Paper makes no mention of private equity or venture capital in the entire document. Presumably, these investments fall into the “Other” category by default, which is assigned the following composite index:
- 25% International Equity
- 25% International Equity (hedged)
- 50% International Fixed Interest
Venture capital has an APRA performance benchmark that is arguably wrong both in terms of risk and return.
Venture capital’s illogical MySuper benchmark creates some interesting scenarios. For example, a superannuation fund with a strategic asset allocation of 10 per cent to venture capital would have significantly outperformed its MySuper benchmark over the last seven years. Here’s how:
- Taking 10 per cent from listed equities (beta = 1) and investing in venture capital (beta < 0.5, as the “other” benchmark is 50 per cent fixed income and has 25 per cent foreign currency exposure) lowers the fund’s growth asset allocation by more than 5 per cent.
- If venture capital outperforms listed equities by five per cent per annum, the fund’s return is +0.5 per cent higher each year.
The flipside is our hypothetical fund is potentially faced with some difficult comparisons in a high inflation and rising interest rate environment.
Earlier years, where a 10 per cent allocation to venture capital greatly improved performance will roll out of the seven-year performance measurement period. They are likely to be replaced by years where venture capital struggles to deal with the effects of deep and protracted equity bear markets.
A fund that is supposedly less risky (remember portfolio beta is, at least according to APRA’s definition, lower) will start to behave like a portfolio that is risker than its notional growth versus defensive split would suggest.
__________
[i3] Insights is the official educational bulletin of the Investment Innovation Institute [i3]. It covers major trends and innovations in institutional investing, providing independent and thought-provoking content about pension funds, insurance companies and sovereign wealth funds across the globe.