US Federal Reserve Chairman Jerome Powell alerted investors to the risk of high and persistent inflation in a recent congressional hearing. MarketFox columnist Daniel Grioli examines what this means for investors.
“We tend to use [transitory] to mean that it won’t leave a permanent mark in the form of higher inflation,” Fed Chairman Jerome Powell said during a congressional hearing on Tuesday, 30 November. “I think it’s probably a good time to retire that word and try to explain more clearly what we mean.”
With these comments, Fed Chairman Powell alerted investors to the risk of high and persistent inflation. We’ll consider why inflation might, for the first time in 30 years, be a problem. My next column will examine what higher inflation might mean for global equities.
At its core, inflation is a supply and demand imbalance. The classic description is ‘too many dollars chasing too few goods’. The COVID pandemic has seen both the amount of dollars increase and the amount of goods and labour decrease.
This column focuses on the US economy. It is the world’s largest economy. Its equity market accounts for approximately 70 per cent of global equity market capitalisation. The long-term interests of most countries are highly correlated with US Treasury Bond yields. So, it makes sense to start with the US when looking at inflation.
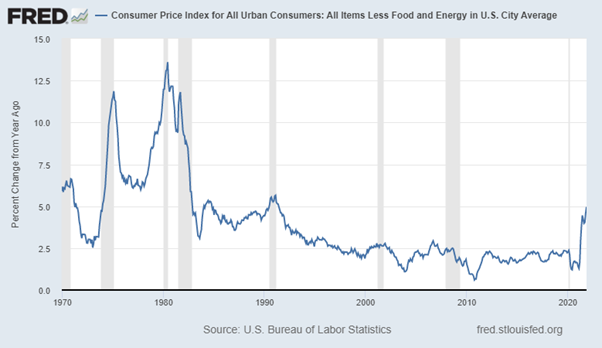
A few charts, courtesy of the Federal Reserve Economic Data (“FRED”) website, tell the story. US Core Inflation (i.e. excluding food and energy costs) is currently 4.96 per cent, the fastest year-on-year growth rate since June 1991. Inflation spent the majority of the last 30 years below 2.5 per cent. The current reading is almost twice as high.
What’s causing inflation to spike? Our first clue comes from Professor Jeremy Siegel, who wrote in Stocks for the Long Run:
Economists have long known that one variable is paramount in determining the price level: the amount of money in circulation. The robust relation between money and inflation is strongly supported by the evidence…
… The strong relation between the money supply and consumer prices is a worldwide phenomenon. No sustained inflation is possible without continuous money creation, and every hyperinflation in history has been associated with an explosion in money supply.
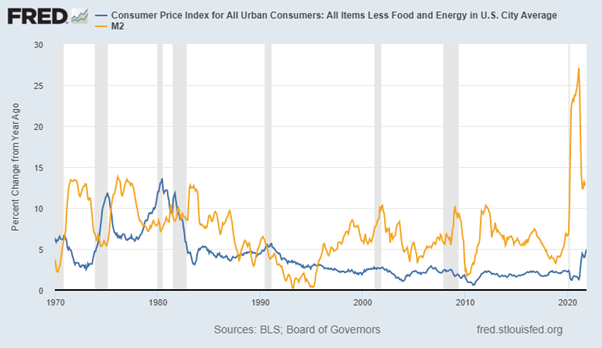
The chart below shows core inflation (blue) and M2 (orange). M2 is a measure of the supply of money. It includes all physical currency, bank deposits and money market accounts. Three important points stand out. Firstly, rapid increases in the money supply preceded the inflation spikes of the 1970s. Secondly, the annual rate of change in M2 reached an all-time-high during 2020. Third, the growth rate of M2 has slowed. But it still remains above the rate that preceded prior inflationary periods.
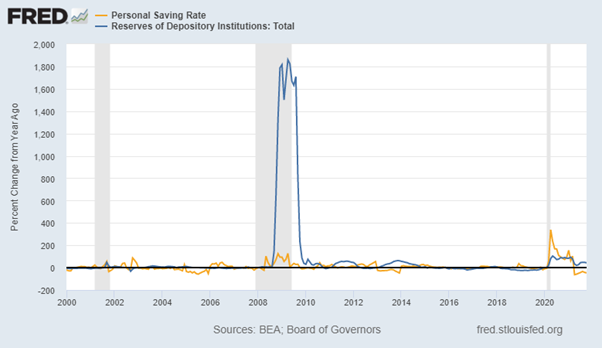
It is also important to track where the money has gone. The next chart shows the reserves of deposit taking institutions (blue) and the personal savings rate (orange). During the Global Financial Crisis, the money went to the banks to repair their balance sheets. The banks needed capital to restore confidence in the financial system.
The pandemic stimulus was different. The majority of the money went to consumers who saved a lot of it. The year-on-year rate of change in personal savings peaked at an unprecedented 339 per cent in April 2020. That money has now started to make its way into consumption.
Economic conditions clearly meet the ‘too many dollars’ criteria. What about ‘too few goods’? Lockdowns associated with the pandemic have disrupted supply chains around the world. Decades of globalisation meant that the world economy was optimised for the ‘just in time’ manufacture and delivery of goods. This allowed many businesses to operate with low inventory levels.
This trend has at least paused, if not reversed, thanks to supply chain disruptions and a growing appreciation of the risk of future pandemic-related lockdowns.
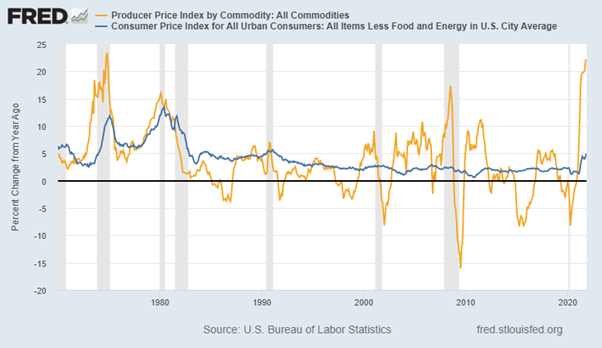
Consequently, the cost of goods has skyrocketed. As the chart below shows, commodity prices are now increasing at levels last seen during the 1970s. This trend will be further exacerbated if companies rush to hedge against further price rises by increasing their inventory.
Until now, the US Federal Reserve has attributed rising inflation to supply bottlenecks. They hoped that these shortages should resolve themselves as countries around the world reopen and economic activity returns to normal. That is why inflation has been described as ‘transitory’ until now.
Most economists are relatively less troubled by ‘supply driven’ inflation. Higher prices eventually result in increased supply and, therefore, lower prices. Supply-driven inflation, they argue, is largely self-correcting.
The most pernicious threat comes from ‘demand-driven’ inflation. This occurs when wages rise. Wage increases could be in response to higher prices. Workers will push for wage increases to offset a higher cost of living. Especially, if they believe that higher prices will persist.
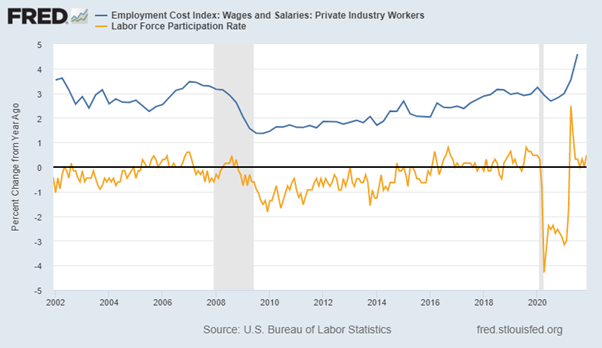
Wage increases could also be caused by a reduction in the supply of labour. This seems to be what is happening now. Lockdowns have largely stemmed the flow of immigrants to developed economies. And the ‘Great Resignation’ has resulted in falling labour force participation. This is especially true of over-55s, many of whom have presumably chosen to retire early.
The chart below clearly shows the tightening of the US labour market. Wages are growing at approximately 4.5 per cent per year, but growth in workforce has now stalled following a post-lockdown bounce.
The US Federal Reserve responded to the pandemic with an unprecedented increase in the supply of money. Unlike previous stimuli, this money made its way directly into the pockets of consumers. At the same time, disruptions to global supply chains have resulted in higher prices for commodities and goods. The Fed had, until now, been willing to look past this ‘supply-driven’ inflation.
There now seems to be increasing recognition that there may also be ‘demand-driven’ causes of inflation. Labour participation isn’t increasing quickly enough. This is despite wages growing at the fastest rate in almost 20 years.
This is why the Fed has now chosen to revise its language, dropping the ‘transitory’ label. It is actively considering whether or not to taper its bond purchase program sooner. There is also the prospect that the Fed may increase short-term interest rates sooner than anticipated.
The MSCI World, ex Australia, index has a 70.64 per cent allocation to US stocks (as at 30/11/2021). And almost 46 per cent of this index is allocated to cyclical growth sectors – Information Technology, Consumer Discretionary and Communications Services.
I’ll explore the possible implications of rising inflation on global equities in the next MarketFox column.
__________
[i3] Insights is the official educational bulletin of the Investment Innovation Institute [i3]. It covers major trends and innovations in institutional investing, providing independent and thought-provoking content about pension funds, insurance companies and sovereign wealth funds across the globe.


