
With most super funds having reported their investment returns for the full financial year, it is clear 2025 was a bumper year. But what lies underneath the headline figures? We speak to rating houses Chant West and SuperRatings about the underlying drivers and discuss how funds differed in their results.
With most superannuation funds having reported their investment returns for the 2025 financial year, it is clear it was a stellar 12 months. Many funds posted double-digit returns, not only for their Growth options, but also for their Balanced options.
Listed equities were an important driver of returns, with United States equity index the S&P 500 up 13.3 per cent for the year, while the domestic equities benchmark ASX 300 posted a 10.2 per cent increase.
US technology stocks did particularly well, with the Nasdaq Composite returning more than 15 per cent for the year, driven by stocks such as Tesla (+51 per cent), Meta (+46 per cent) and Nvidia (+27 per cent).
But it wasn’t just listed equities that propelled super fund returns forward. Every asset class posted a positive return.
Infrastructure holdings returned on average double-digit returns, with international listed infrastructure returning a whopping 16.3 per cent.
Australian bonds and international bonds had their best year since 2019, increasing 6.8 per cent and 5.4 per cent respectively. Unlisted property, which showed negative returns in the previous two years, also closed higher, albeit marginally.
Even currency worked in super funds’ favour, Mano Mohankumar, Senior Investment Reseach Manager at Chant West, points out.
“Foreign currency was also a meaningful contributor due to the depreciation of the Australian dollar, with the international shares return of 13.7 per cent (reflected in hedged terms) translating to 18.6 per cent in unhedged terms,” Mohankumar wrote in a note.
On average, super funds hedge about 70 per cent of their international equities portfolios and so they benefited handsomely from this dynamic.
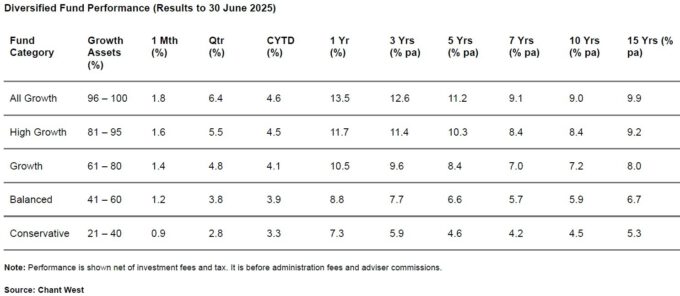
All this means that the median performance of superannuation investment options with a growth allocation of 61 to 80 per cent, the most common range for MySuper options, was 10.5 per cent for the year, according to Chant West.
For three years in a row, most MySuper options have now delivered 9 per cent or more, but this is far from normal, Mohankumar says.
“The typical long-term return objective for growth funds is to beat inflation by 3.5 per cent per annum, which translates to roughly 6 per cent p.a. Since the introduction of compulsory super, the annualised return is 8 per cent and the annual CPI increase is 2.7 per cent, giving a real return of 5.3 per cent p.a. – well above that 3.5 per cent target,” he says.
Funds have achieved this while staying within their risk parameters, Mohankumar says. Typically, a growth fund would aim to post no more than one negative return in five years on average. This objective would translate to no more than six negative years over the past 33 years.
“As it turns out, there have only been five negative years, so the risk objective has been met, as well as the performance objective,” Mohankumar says.
Assessing Non-market Drivers of Return
Despite all asset classes going up, there are some differences between the individual fund performances. Equities showed a dispersed performance, which is illustrated by Apple posting a negative performance of 5 per cent, while Meta posted a positive return of 46 per cent.
Winners were not easy to pick based on fundamentals alone, which meant funds with higher allocations to passive holdings tended to do better.
“Passive allocations did well this year; better than most factors,” Joshua Lowen, Insights Manager at SuperRatings, says in an interview with [i3] Insights.
“Similar to last year, there were a handful of shares that really stood out, like Nvidia in the United States or CBA in Australia. They just had really strong returns. Any investment option that helped overweight those kinds of assets outperformed as a result.
“If you’re looking at the median balanced option, that was just over 10 per cent. Your balanced index options are probably at higher levels, 12 per cent, so that’s definitely driving it.”
The move to passive investing among super funds is partly driven by larger funds running out of capacity. They can’t split their allocations across too many managers without ending up with benchmark returns and so they are forced to hold more funds at market weights.

The Your Future, Your Super test resulted in the average allocation to hedge fund-type strategies being reduced to very low [levels]. We would say, on average, less than a per cent would be invested in hedge fund-type strategies – Mano Mohankumar, Chant West
But partly the move to passive is also a result of the Your Future, Your Super performance test, which penalises tracking error, although the extent of the test’s impact should not be overestimated, Mohankumar says in an interview with [i3] Insights.
“The areas that were probably most impacted by the performance test were the increase in passive and enhanced passive management. But not all of that is Your Future, Your Super related,” he says.
“Some of that is managing your fee budget and thinking perhaps we can allocate that fee budget in other areas where we feel we can add more value for our members. They might invest more in some sectors within private markets and reallocate active fee budget to it.”
He also points out the performance test had a more dramatic effect on hedge fund allocations, which have fallen to nearly nil in recent years.
“The Your Future, Your Super test resulted in the average allocation to hedge fund-type strategies being reduced to very low [levels]. We would say, on average, less than a per cent would be invested in hedge fund-type strategies,” he says.
“The performance is part of it. Historically, hedge funds haven’t delivered the outcomes that maybe were expected, but I think Your Future, Your Super almost killed off hedge funds in super fund portfolios.”
Larger is Not Always Better
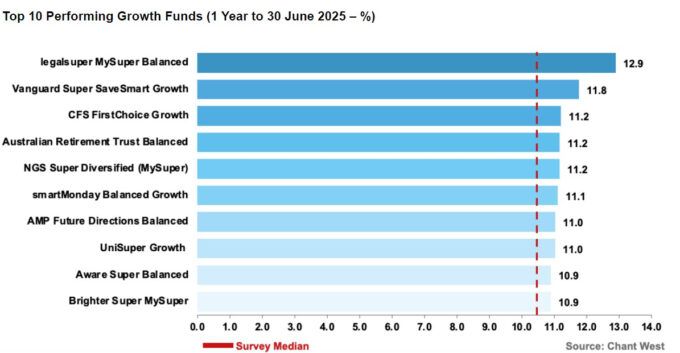
Lowen also points out it wasn’t just the large funds that did well. LegalSuper turned out to be the top-performing fund in the Balanced option range, as defined by SuperRatings to be 60 to 76 per cent growth assets.
“Something that did stand out to me when I’m looking at the top-ranked funds is some smaller funds we expect will be pretty highly ranked this year. And so that is interesting to see,” Lowen says.
“You hear a lot of commentary about how funds have to get bigger to be the best. But if you look at LegalSuper, in particular, it stands out.”
LegalSuper’s MySuper Balanced fund option closed the year 12.6 per cent higher, with an asset allocation split of around 75/25. Chant West reports LegalSuper’s performance as 12.9 per cent for the year, but that is because they calculate returns after investment fees, but before administration fees, while the fund’s themselves take administration fees into account.
“That is going to put them right at the front of the pack for the Balanced option,” Lowen says.
Another observation is that the returns of High Growth options among the different funds are closer together than those of Balanced fund options. Lowen argues this is because Balanced options tend to be more diversified than High Growth options.
“There is greater diversification in those Balanced options. Particularly in not-for-profit funds, there is quite a significant unlisted component, less so in retail offerings, although that is changing,” he says.
“Whereas to get the growth exposure that you want in those Growth or High Growth options, they do track shares a lot closer. That is why you end up with more concentrated outcomes.”
Common Issues with Comparing Fund Options
In a previous article, we discussed that comparing fund options isn’t always straightforward. Not only do funds use different target asset allocations, but even how funds define growth and defensive assets can differ quite substantially. Lowen says this makes comparison harder.
“Growth/defensive splits are probably one of the most complex issues across the industry. There isn’t much consensus as to how to define growth assets and what the bands should be,” he says.
“We have our own definitions of the bands. Other research houses and the regulator have different bands that they put together.
“I think the main thing that’s most important to focus on is that funds stay true to label. So if they label an option as High Growth, then it really needs to be mostly growth assets, short of a full all shares option.”
Life-cycle options are particularly hard to compare, not just against single diversified options, but even against each other.
Something that did stand out to me when I'm looking at the top-ranked funds is some smaller funds we expect will be pretty highly ranked this year. And so that is interesting to see – Joshua Lowen, SuperRatings
An illustration of the difference between life-cycle option design is the MySuper products of Aware Super and smartMonday MySuper. SmartMonday, managed by Future Group, has a life-cycle default option, which has nine different cohorts and starts derisking portfolios after age 35 with five-year intervals until age 75.
Aware’s life-cycle fund takes a very different approach. It leaves members in a High Growth, 100 per cent growth assets portfolio until age 55, but then adjusts the portfolio every year until the member reaches age 65.
How do you compare all these different designs?
“That is a real challenge for us as a research house, the comparison between life-cycle and non-life-cycle investment options,” Lowen says.
“We’ve got a couple of different ways that we look at it. We do an age-based analysis. For example, we will put out a performance table based on a member of a specific age.
“Usually we do a younger age, 45 and below, because that’s where a lot of those life-cycle funds start. Anything under that age is very similar. Then we’ll look at different ages.”
SuperRatings also compares the risk and return of the various investment options at the hand of a so-called ‘equivalent lifetime return model’.
“We don’t publish that one very often because it’s quite a complex model. Here, we’re looking at lifetime equivalent returns and then looking at the level of risk that members are exposed to as they enter retirement,” Lowen says.
“What that does is it plots outcomes on a quadrant to say: ‘This fund is giving you higher returns, but at a higher risk than the median.’
Mohankumar agrees that comparing life-cycle strategies is difficult, especially for older cohorts.
“It is complex, because even within life-cycle strategies they’re implemented differently. It’s very clean when you look at young members, you can typically compare it with a High Growth universe, but once the derisking commences, that’s when it’s hard to compare,” he says.
__________
[i3] Insights is the official educational bulletin of the Investment Innovation Institute [i3]. It covers major trends and innovations in institutional investing, providing independent and thought-provoking content about pension funds, insurance companies and sovereign wealth funds across the globe.