Maaike van Tol, Director of Portfolio Design, New Zealand Super

Maaike van Tol, Director of Portfolio Design, New Zealand Super

Building An Institutional Memory at NZ Super

Fund Accelerates Professionalisation of Data Management

NZ Super is gearing up to combine a multitude of investment data models across the organisation into a central model-of-models, which should lead to better investment decisions and cost savings

New Zealand Superannuation Fund’s (NZ Super) efforts to build a comprehensive data analytics function that sits inside the investment team have progressed to the point where it can now start using cross-team models and data to make better investment decisions.

The fund has implemented two key projects recently. One initiative is a portfolio portal that houses deal-specific information, as well as cash-flow projection models that are used for the total portfolio and for individual portfolios.

Another initiative is the tying of asset allocation models together in a single model-of-models, providing consistent data to be used across the organisation and gain new insights.

The next step is to start tying all the models together into a central model-of-models that enables investment specialists to access all information at one point.

image shows a quotation mark

At the moment, as I'm sure is the case in many organisations, you can find lots of different pieces of information in lots of different places, [but] it is really useful to have all of that information in one place

The fund has streamlined its system to ensure all models are coded in a single computer language, Python, and it is now in the process of moving to a cloud-based data platform that acts as a managed service for storing, processing and analysing data, called Snowflake.

The system helps its staff make better investment decisions, achieve higher productivity and better mitigate risk, but it also saves historical data to better manage the organisational knowledge it has built up over time.

“At the moment, as I’m sure is the case in many organisations, you can find lots of different pieces of information in lots of different places, [but] it is really useful to have all of that information in one place,” Maaike van Tol, Director of Portfolio Design at NZ Super, said at the recent [i3] Investment Strategy Forum 2025 in Torquay, Victoria.

“We’re in a situation where we have our asset allocation models all in Python and we’re now getting to a stage where we can start using those models together in portfolio construction. We are now working on the data layer to allow consistent data to be used both within our team and across the organisation, which will also have cost savings associated with it.

“The historical data can be saved as well and it allows us to build institutional memory over time.”

Starting The Data Transformation

NZ Super’s data transformation started when Stephen Gilmore joined the fund in 2019 as its new Chief Investment Officer and found a sea of spreadsheets and a wide array of different systems being used.

For example, one team preferred the programming language MATLAB, while other staff members used R for data analysis. Everyone used lots of Excel sheets.

“There were lots of different things that people were using and [there was] duplicate data across different teams, which also meant we were paying for data multiple times,” van Tol said.

Gilmore wanted to have a number of key data points at his disposal to quickly check the latest, up-to-date figures on risk, return, positions and deal flow. And so the asset allocation team was tasked with building a number of dashboards to present the right information.

Gilmore also established a data analytics team to help the effort, appointing Kathryn Kerner to head the new team.

“We had a new CIO, Stephen Gilmore, and when he came in he found a lot of tools, a lot of models, but it was really hard for him to get everything he needed in front of him,” van Tol said.

“So he wanted an enhanced suite of dashboards that would expose the portfolio to him. He wanted them to be always accessible, he wanted the senior leaders to be able to see these dashboards and be able to help them make whole-of-portfolio decisions.”

image shows a quotation mark

We had a new CIO, Stephen Gilmore, and when he came in he found a lot of tools, a lot of models, but it was really hard for him to get everything he needed in front of him. So he wanted an enhanced suite of dashboards that would expose the portfolio to him

The fund moved to two primary systems for programming dashboards, Power BI and Streamlit, and ensured there was version control of the models, so that programmers could track and manage changes over time. It allowed them to collaborate more efficiently, revert to previous versions when needed and track the history of modifications over time.

“The fund started off with what we had immediately available in different spreadsheets and models and just built dashboards to expose that. This really gave the senior leaders what they needed,” van Tol said.

“Then Stephen also decided to set up a data analytics function and there was really a push toward professionalisation. We started programming in Python, there’s version control, there are programming standards and a team that validates models. Everyone’s coding in the same language, creating packages of code and that allows us to reuse code.

“A lot of the younger people had to learn how to program in Python and the data analytics team now runs Python programming courses for the investment team and for leaders to really help bring people up the curve.

“We’ve basically gone from being reasonably unsophisticated to having a really, really good system, where we have packages of code and it’s become quite professional.”

New Dashboards Show Deal Flow and Buy, Hold and Sell Data

In recent months, the team has added several new dashboards to the existing risk, exposure and hurdle calculator dashboards. Rather than providing a snapshot of the current portfolio, these dashboards show how the portfolio is likely to develop, facilitating management of the portfolio through time.

For example, the team developed a buy, hold and sell dashboard that gives an overview of which assets the fund wants to keep or offload. The dashboard is maintained by portfolio managers and strategists, who fill in the various fields. It allows senior management, including the new co-CIOs, Brad Dunstan and Will Goodwin, to understand how portfolio managers are thinking about their investments.

“It facilitates really good conversations with our new co-CIOs as to: ‘Why do you want to buy more of this? Why do we want to sell this?’ or ‘You said you were going to sell this, how are you going on that?’” van Tol said.

image shows a quotation mark

[The dashboards] facilitate really good conversations with our new co-CIOs as to: ‘Why do you want to buy more of this? Why do we want to sell this?’ or ‘You said you were going to sell this, how are you going on that?

Another recently developed dashboard looks at the deal pipeline, which allows the new co-CIOs to know which deals are coming up and how many resources are required to get transactions over the line.

“It allows the co-CIOs and the investment committee to say early on if they actually don’t think it is something that is worthwhile. Or at least to have a really good conversation about it,” van Tol said.

“That brings it back to the total portfolio approach. Because we don’t have an SAA (strategic asset allocation), it’s not always clear what people could be working on. It’s quite possible that someone was working on a particular deal when they actually should be working on something else.

“And so the lack of SAA means that tools like these are really necessary to make sure that people are working on the right things and that the portfolio is moving in the right direction.”

Dashboards’ Role in Board, IC Communication

The dashboards are not only a tool to understand NZ Super’s investments at a total portfolio level; they also help communicate the team’s strategy and outlook on the various holdings and markets. To a degree, they function as an educational tool.

For example, the dashboards help with communicating changes or answering broader questions from the board and investment committee and often form a starting point for robust discussion.

One set of dashboards shows the fund’s risk positions and the team’s liquidity assumptions, including how much liquidity is available.

“Those are probably the ones that elicit the largest amount of conversations,” van Tol said.

“I had a look at an old board report, comparing it to a new board report, and they’re worlds apart.

“Previously, there were just two risk numbers – the total amount of risk and the active risk that was being taken – and so being able to drill down further to show where risk is being taken is very useful.”

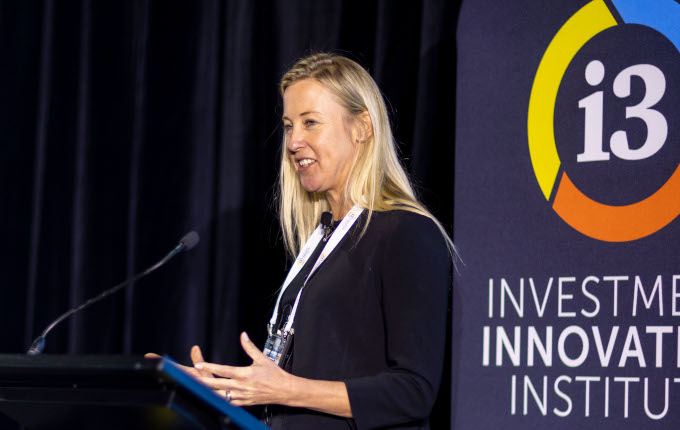
Maaike van Tol, Director of Portfolio Design at New Zealand Super, spoke at the [i3] Investment Strategy Forum 2025, which was held on 8 and 9 May 2025 in Torquay, Victoria.

__________

[i3] Insights is the official educational bulletin of the Investment Innovation Institute [i3]. It covers major trends and innovations in institutional investing, providing independent and thought-provoking content about pension funds, insurance companies and sovereign wealth funds across the globe.