With inflation rising and stagflation becoming a real possibility, MarketFox columnist Daniel Grioli looks back in time to find evidence of supposed inflation hedges. Delving into past literature, he finds that the performance of stocks during periods of high and rising inflation is rather dismal.
Which asset classes and sectors do well during periods of rising inflation and which suffer? Answering this question is difficult.
Firstly, the global economy hasn’t experienced a period of persistently high inflation for over four decades. Most investors working today have little-to-no adult memory of high inflation. Myself included.
Secondly, it can be difficult to find contemporary sources and data from earlier inflationary periods. And the research and data that is available is often quite rudimentary by today’s standards.
The answer to this question will make many institutional investors uncomfortable. But before we get to that, let’s examine a contemporary source and some history on inflation and its effects.
After scrounging around the internet, I managed to obtain a copy of The Myths of Inflation and Investing by Steven Leuthold.
Leuthold founded a successful investment advisory and mutual fund management company that still bears his name today. The book was published in 1980, when I was less than 12 months old and has long been out of print.
Leuthold examines the evidence for two widely-held investor beliefs:
- Stocks are an inflation hedge
- Interest rates are composed of two building blocks: a term premium, or real interest rate, and expected inflation
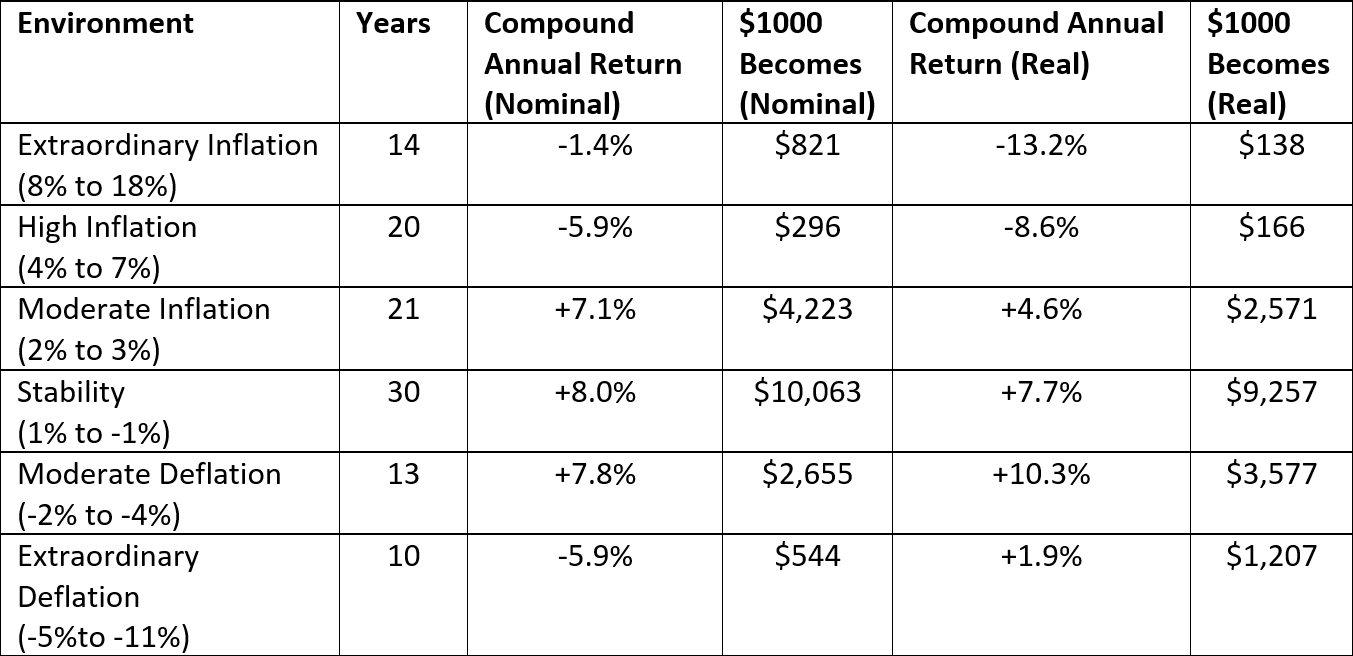
He examined the annual returns of US stocks from 1872 to 1979 under different inflationary regimes. The table below summarises Leuthold’s results.
The belief that stocks are an inflation hedge is a myth. As the table shows, stocks have generated most of their long-term returns during periods of stable prices along with periods of modest inflation or deflation.
Stocks hate both extraordinary inflation and deflation. High inflation is especially lethal for stocks.
Here’s Leuthold summary of the performance of stocks during inflationary periods.
During the past 108 years there have been 34 years with annual inflation rates of 4 per cent or higher. In only seven of these years did the stock market manage to keep pace or rise more than the inflation rate (excluding dividends).
In those 108 years, including 1979, there have been eight years when inflation blazed at levels of 10 per cent or higher. The stock market was not able to outperform the inflation rate in even one of those eight years.
What about periods where inflation was high and rising? Leuthold identified 17 years where inflation was above four per cent and more than two per cent higher than the previous year. The performance of stocks during periods of high and rising inflation is dismal:
- Average annual return (nominal) = -7.1%
- Average annual return (real) = -15.0%
- Median annual return (nominal) = -3.2%
- Median annual return (real) = -12.2%
I probably don’t need to remind you that 2022 is, so far, a year where inflation is above four per cent and more than two per cent higher than the previous year.
Not only were average and median returns low, they were accompanied by significantly higher drawdown risk. Leuthold explains:
First, even though the actual up years and down years are almost balanced (eight up, nine down), the losing years were really big losers, declining an average of 20 per cent. Also, the years of market advance were marginal at best, averaging five per cent.
In other words, investors have historically received a 1:4 risk/return ratio investing in US stocks when inflation is high and rising.
What about bonds? Leuthold found that the real interest rate is also a myth:
In years when inflation was more than 5.5 per cent, the average real rate of interest was minus 5.37 per cent. The median rate was minus 4.26 per cent… For all years when inflation was in excess of 2.5 per cent, the average ‘real’ rate of interest was minus 2.14 per cent and the median rate was minus 0.89 per cent…
… In summary, there seems to be little longer term evidence supporting or even suggesting the conclusion that market or nominal rates of interest (long or short term) are historically intrinsically comprised of two components: the real rate of interest and a quantifiable expected rate of inflation…
… The entire concept of an intrinsic ‘real’ rate of interest has been almost blindly accepted by most investors, economists and now politicians as economic fact. Few have bothered to critically examine or even question the validity of this concept. The experts are being taken at face value, just as was the case with the ‘stocks are an inflation hedge’ doctrine.
The Myths of Inflation and Investing is full of interesting data and analysis. I found Leuthold’s theory of ‘Metamorphic Inflation’, based on a thousand years of data from Europe and the US to be especially thought-provoking. A story for another time, perhaps.
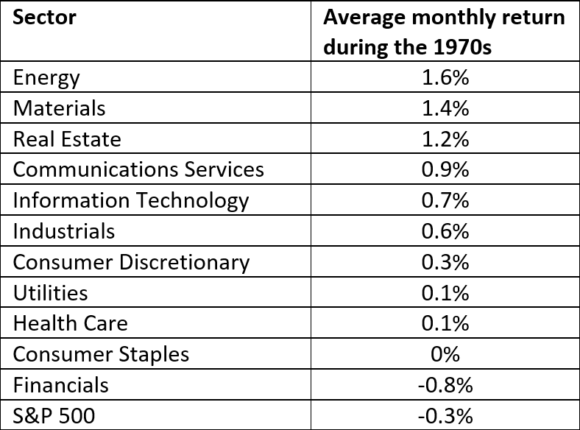
Stocks and bonds are likely to suffer from poor returns and higher volatility. Where can investors turn look for market-beating returns in an inflationary environment? It requires a willingness to take sector and industry positions that most institutions can’t stomach. The best performing industry sectors during the last period of high inflation were cyclical and commodity companies.
That’s right, the very stocks that most institutional investors are either limiting their exposure to or divesting from on environmental, social and governance (ESG) grounds. The same stocks that contribute a lot of tracking error to an equity portfolio. And tracking error is the last thing that many superannuation funds can afford in a Your Future Your Super (YFYS) world.
The asset class benchmarks selected for YFYS are heavily exposed to stocks that have benefitted from four decades of low and falling inflation. Many of these secular leaders will fall prey to what legendary US stock trader Mark Minervini’s calls the 50/80 Rule:
When a secular leader makes a major top (reaches a highest point after a steep price increase), there’s a 50 per cent chance it will drop 80 per cent and an 80 per cent chance it will drop 50 per cent. The average decline of a former leader is more than 70 per cent peak to trough.
Minervini’s rule is based on a long-term statistical analysis of US stocks. If you don’t believe him, consider the performance of the ‘Nifty Fifty’ stocks during the 1970s or high-flying tech stocks during the tech crash.
The table below, courtesy of Investor’s Business Daily and CFRA shows the average monthly performance of US stocks in each GICS industry sector during the 1970s.
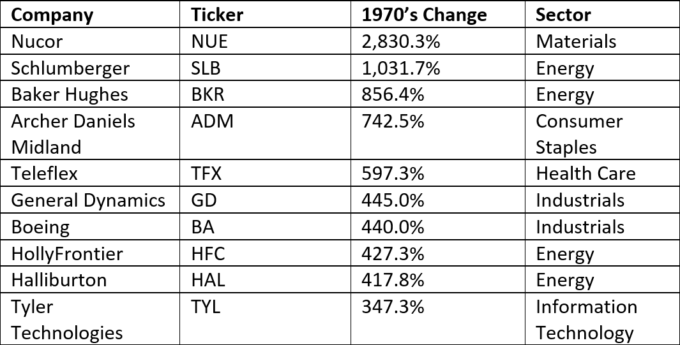
Some of the stocks in these sectors had eye-popping returns. Here are the top 10 performing US stocks during the 1970s.
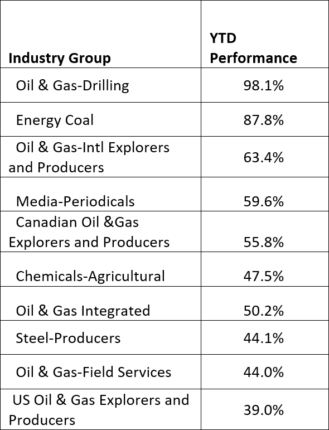
A similar pattern is occurring in 2022. Here are the top 10 industry groups in the US stock market, ranked by year-to-date performance. As you can see, it’s a veritable rouges’ gallery of ESG-challenged industries.
The S&P 500 Index is down -7.9 per cent so far this year (as at 18/4/2022).
Investors have some tough choices ahead if inflation persists. Stocks and bonds, the foundations of all multi-asset portfolios are highly unlikely to deliver satisfactory returns. The areas of the equity market that could offer relief are unpalatable to most investors. What are investors to do?
__________
[i3] Insights is the official educational bulletin of the Investment Innovation Institute [i3]. It covers major trends and innovations in institutional investing, providing independent and thought-provoking content about pension funds, insurance companies and sovereign wealth funds across the globe.


